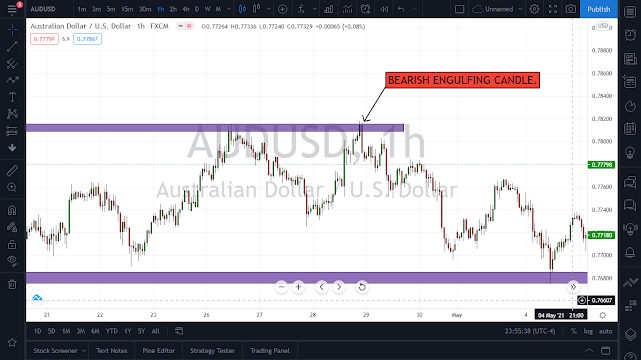
BEARISH ENGULFING:
DEFENITION:-
* The Bearish Engulfing is a two-day bearish reversal pattern.
*Two opposite-coloured real bodies distinguish it.
*In a bearish scenario, the second day’s black real body must totally engulf the first day’s white real body.
*The shadows are not important here.
RULES FOR ENTERING INTO A TRADE:-
1. An uptrend must be in progress.
2. The first day must be a green candle.
3. The second day opens with a gap above the real body of thegreen candle but declines sharply to close below the real body of the first candle. In other words, the second day’s real body completely engulfs the first day’s real body.
4. The shadows of either day are unimportant. But the colour of the second day’s real body must be red. A greater than average black real body on the second day increases the likelihood of a successful bearish reversal.
5. The Japanese name for “engulfing” is tsutsumi. The equivalent pattern in Western charting is an “outside day.”
INTERPRETATION;-
1.The Bearish Engulfing is the most bearish of all bearish reversal patterns because the counterattack by the bears on the second day completely nullifies the control exerted by the bulls on the first day.
2.The second day’s close below the first day’s open implies a complete change in the psychology of the big players who have now turned bearish.
PROPER ACTION:-
1. Sell signal. No confirmation is required for the aggressive trader. But for the conservative trader, a bearish confirmation is suggested.
2.To confirm a sell, the third candle must close below the lowest low of candles 1 and 2. Place buy-stop above the highest high of candles 1 and 2.
3.Best if found at a high price area or when market is overbought.
EXAMPLE CHARTS:-
REAL CHART (example):-


0 Comments